One does not simply walk into Mord- uh, Florida.
12 Likes
A couple more REMs I worked up recently…
Red River, TX-OK border, northeast of Paris, TX:
The Red River has taken so many paths over time that it really doesn’t follow the old border much anymore. Here’s a version with the legal boundary (red dashed line) superimposed on the current course:

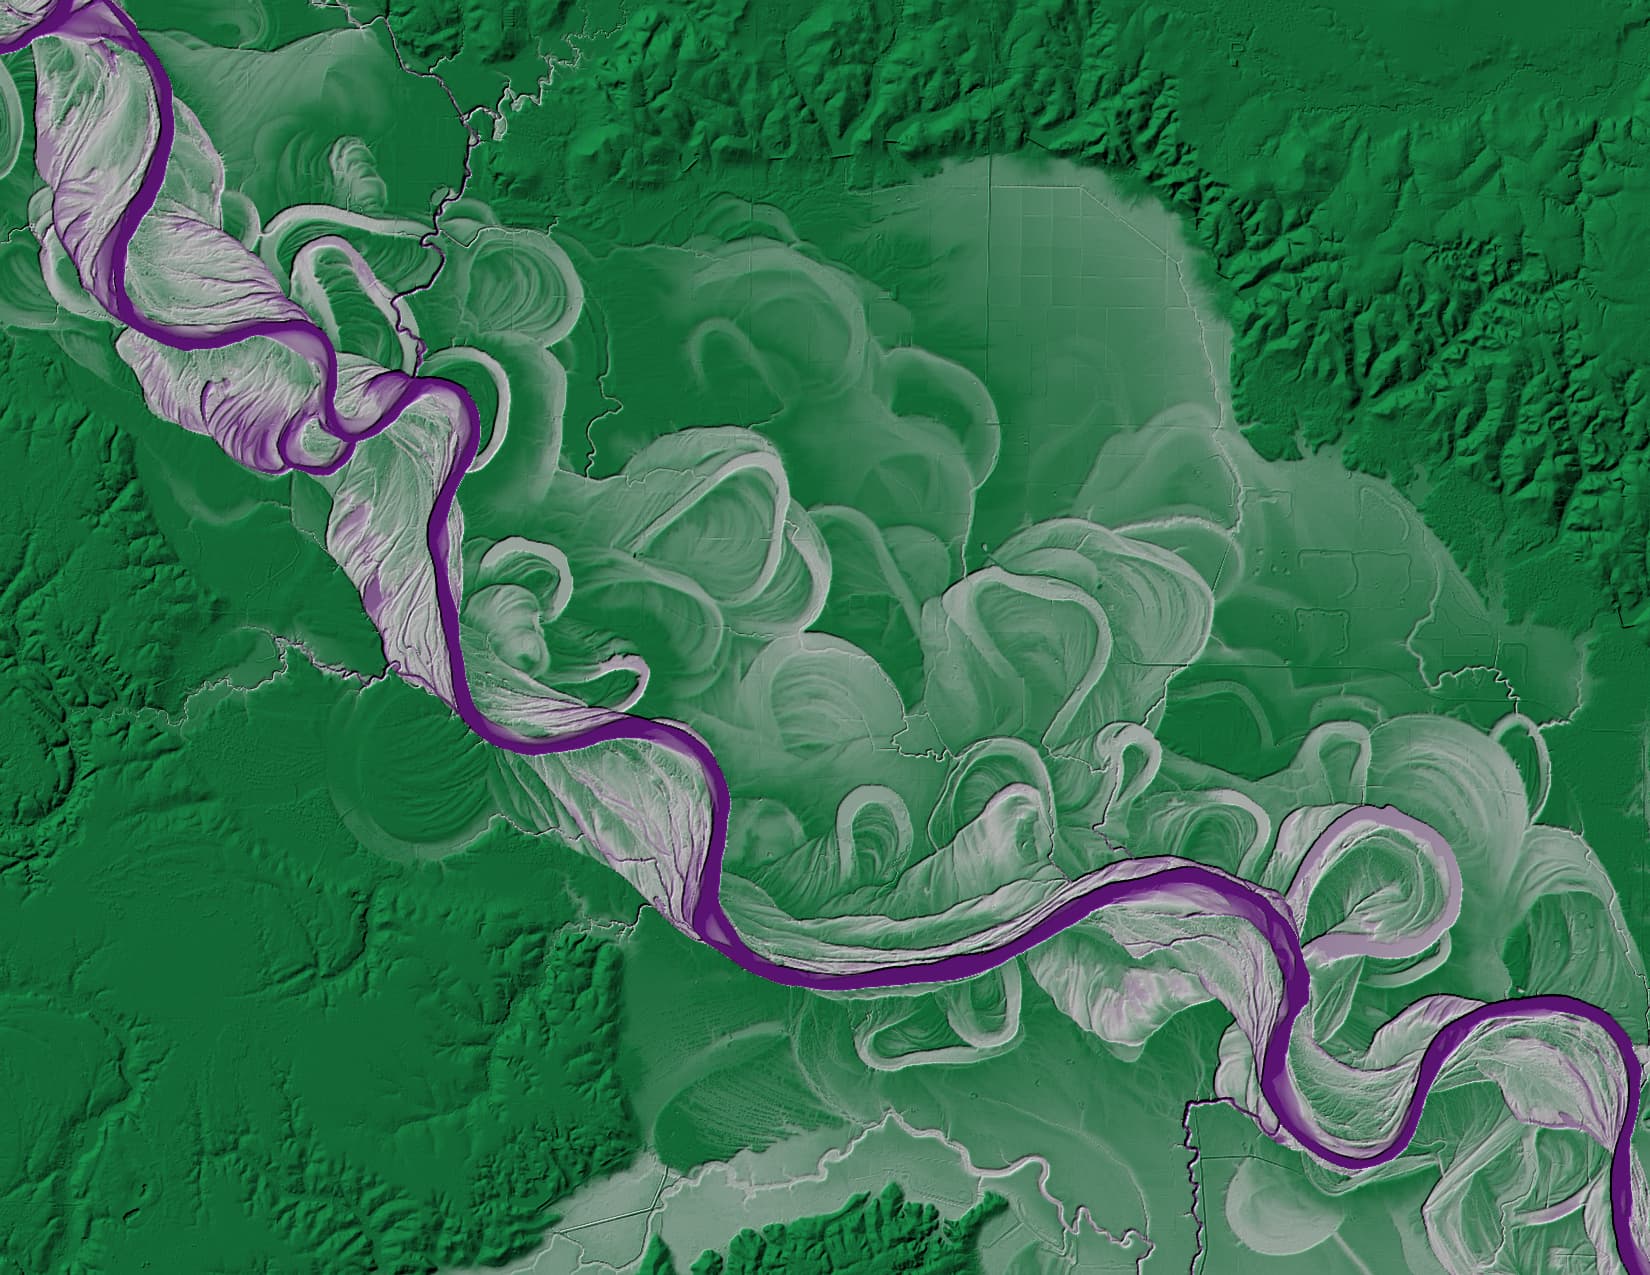
Ouachita River at Monroe, Louisiana:

Area around the Old River Control Structure in Louisiana:

This one is super interesting to me, as I grew up not far from here and learned all about it in grade school. The ORCS (just below center) and several similar structures to the northeast are all that prevents the Atchafalaya River from capturing the entire flow of the Mississippi River, leaving Baton Rouge, New Orleans, and other places down the delta high and dry. The Atchafalaya is dark brown here, showing that it’s significantly lower than the Mississippi winding down along the right. A well-equipped terrorist could cripple a big section of the US economy by breaching the ORCS.
16 Likes
This really helps illustrate why having water front property by a creek or river is a bad idea. The water is going to go where it wants to go
12 Likes
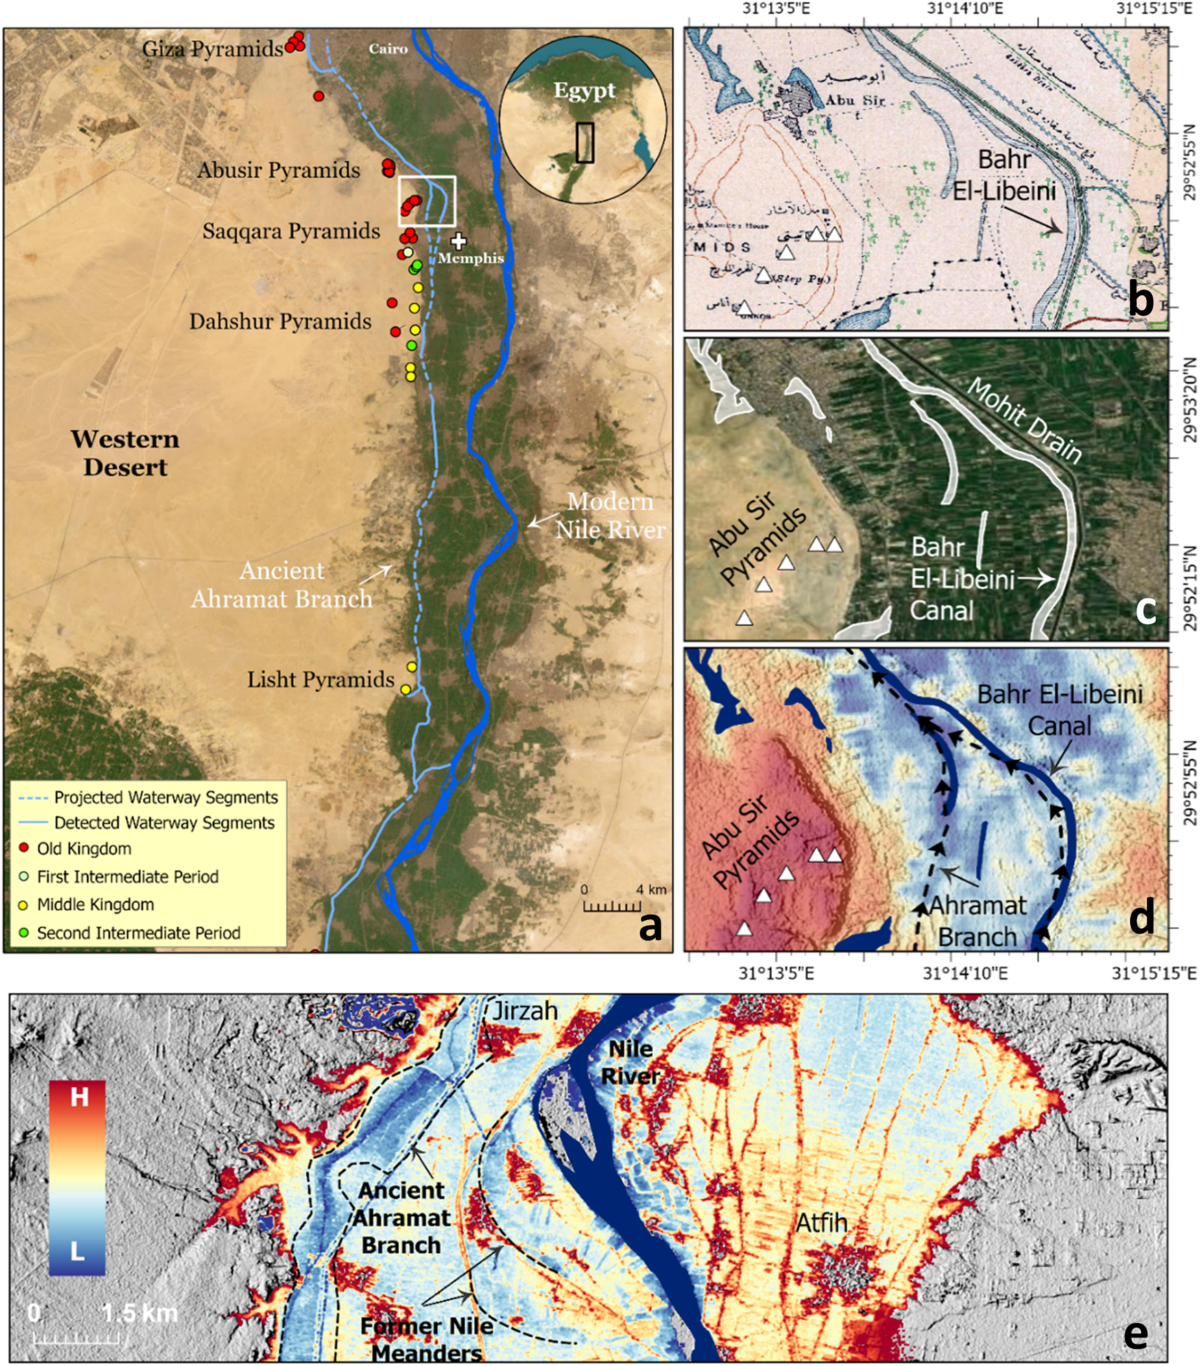
The Nile sure has done some wandering just in historic times.
13 Likes

Here’s the definitions for the scale used in that map:
I must admit I was confused by those scores at first glance.
13 Likes
I’m not downplaying the consequences of low literacy, but this map oversimplifies and exaggerates the range of literacy across the US. I was curious about the odd scale used here, so I had a look at the NCES PIACC data. The literacy score is a range of 1-500, further generalized into 5 levels. This map doesn’t say so, but it shows the average of all literacy scores for each state.
All states and US counties (and equivalents) have average literacy scores of 189 to 299, and just 43 (out of 3,142) US counties have average literacy scores in level 1. The rest are all in level 2 or 3.
This map makes it look like southerners are illiterate. But if you look at county-level map, it’s clear that poverty is a major factor (ain’t it always?), along with perhaps the prevalence of people whose native language isn’t English.

11 Likes

This data is pretty interesting. Just fiddling with the interactive county-level map controls shows some patterns. Statewide education standards, both past and recent, clearly also play a major role.
Ages 16-24:

North Dakota, Nebraska, Iowa, Illinois, Virginia, Vermont pop out as states that prioritize literacy in schools.
Ages 65-74:

Nevada, Iowa, upper Midwest in general. The state differences are striking, especially across the Ohio River boundary and the 37th parallel. 65-74 year olds would have been born in the 1950s (i.e. boomers) and educated in the '50s and '60s.
10 Likes
Here’s a perhaps less alarming map I just whipped up from the data:
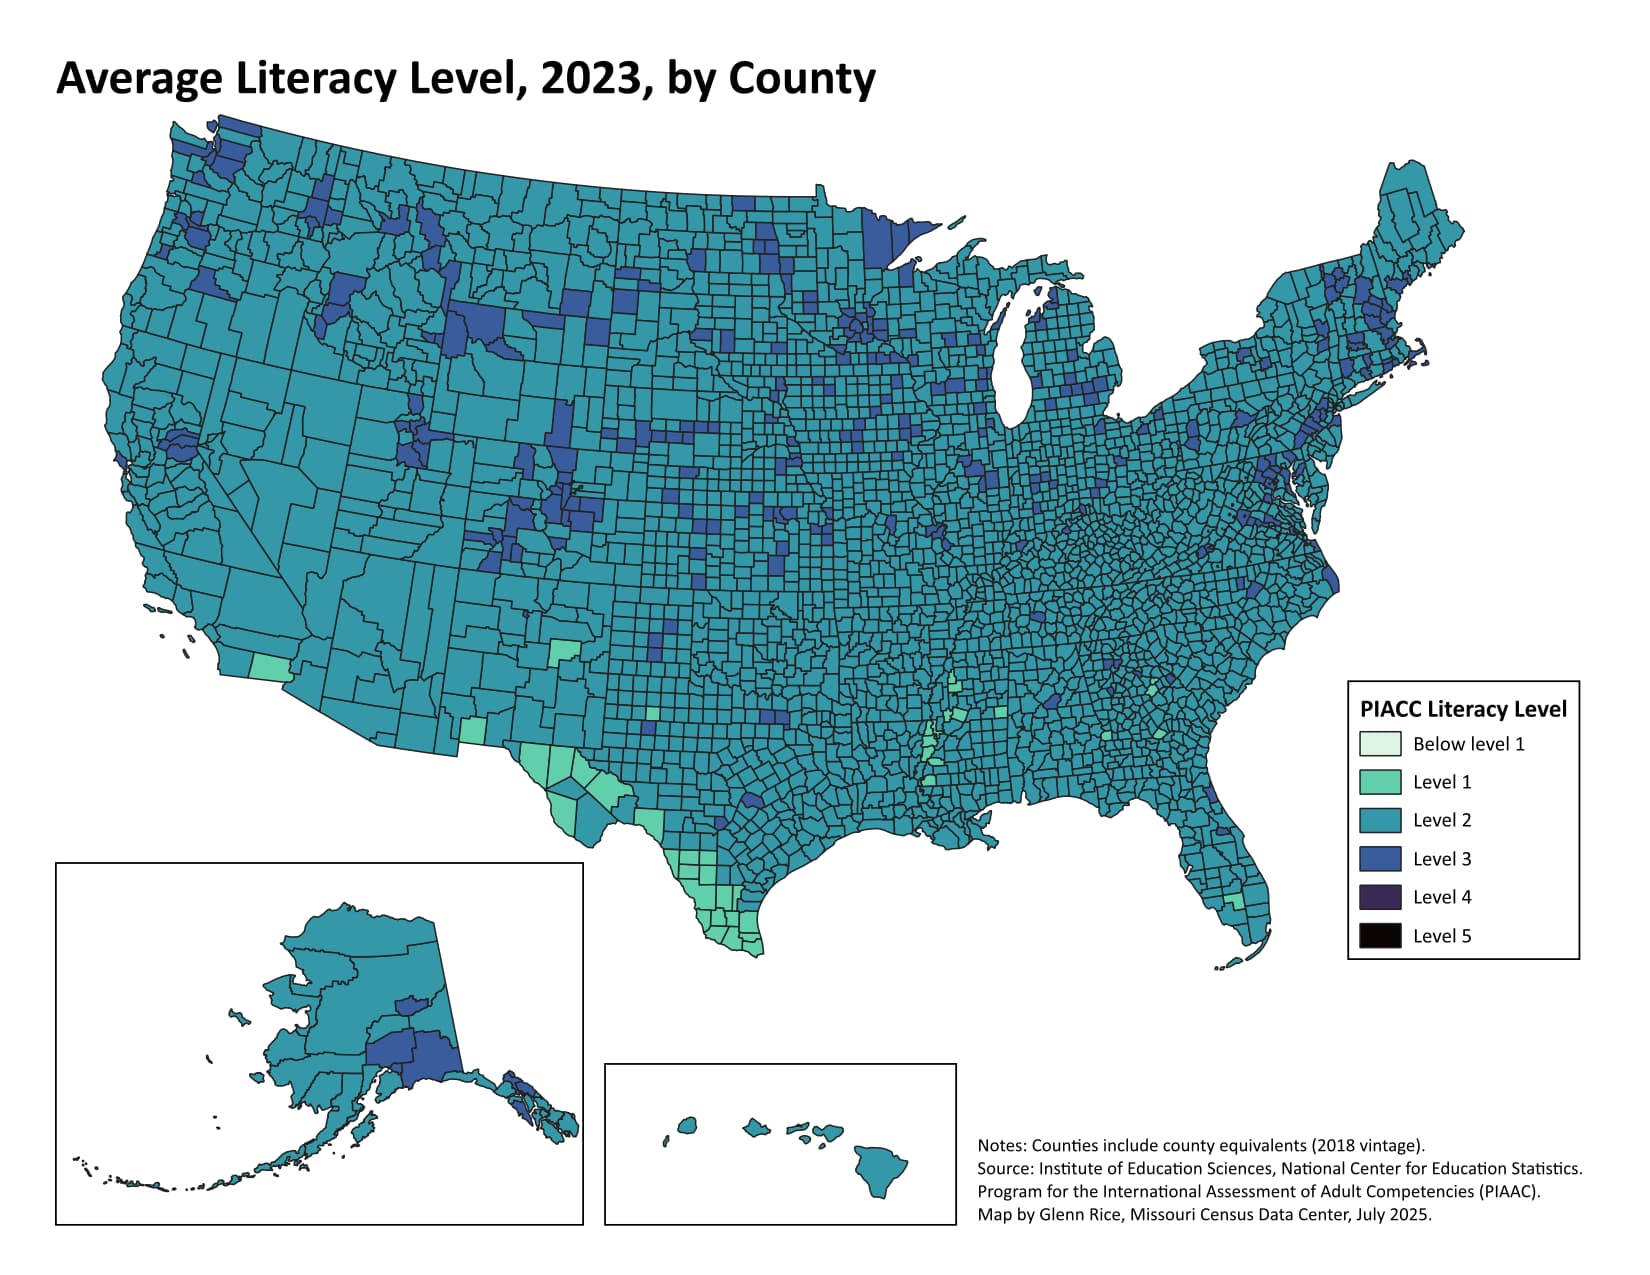
There are zero counties with an average PIACC literacy level below 1 or greater than 3. There are just 43 counties at level 1. The vast majority (2,804) are at level 2, and another 295 are at level 3.
Edit: fixed AK and CT
11 Likes
I just dived into the data to see if I could guess the highest scoring county in the USA, I wasn’t far off.
First place goes to Falls Church, Virginia- the second richest county in the country.
2nd place to Hamilton County, Indiana, on the edge of the Indianapolis suburbs
3rd is Los Alamos, New Mexico.
11 Likes
For reasons of their own, the U.S. Census Bureau publishes a county adjacency file. I’ve never understood what you might use it for. Anyway, here it is, mapped.
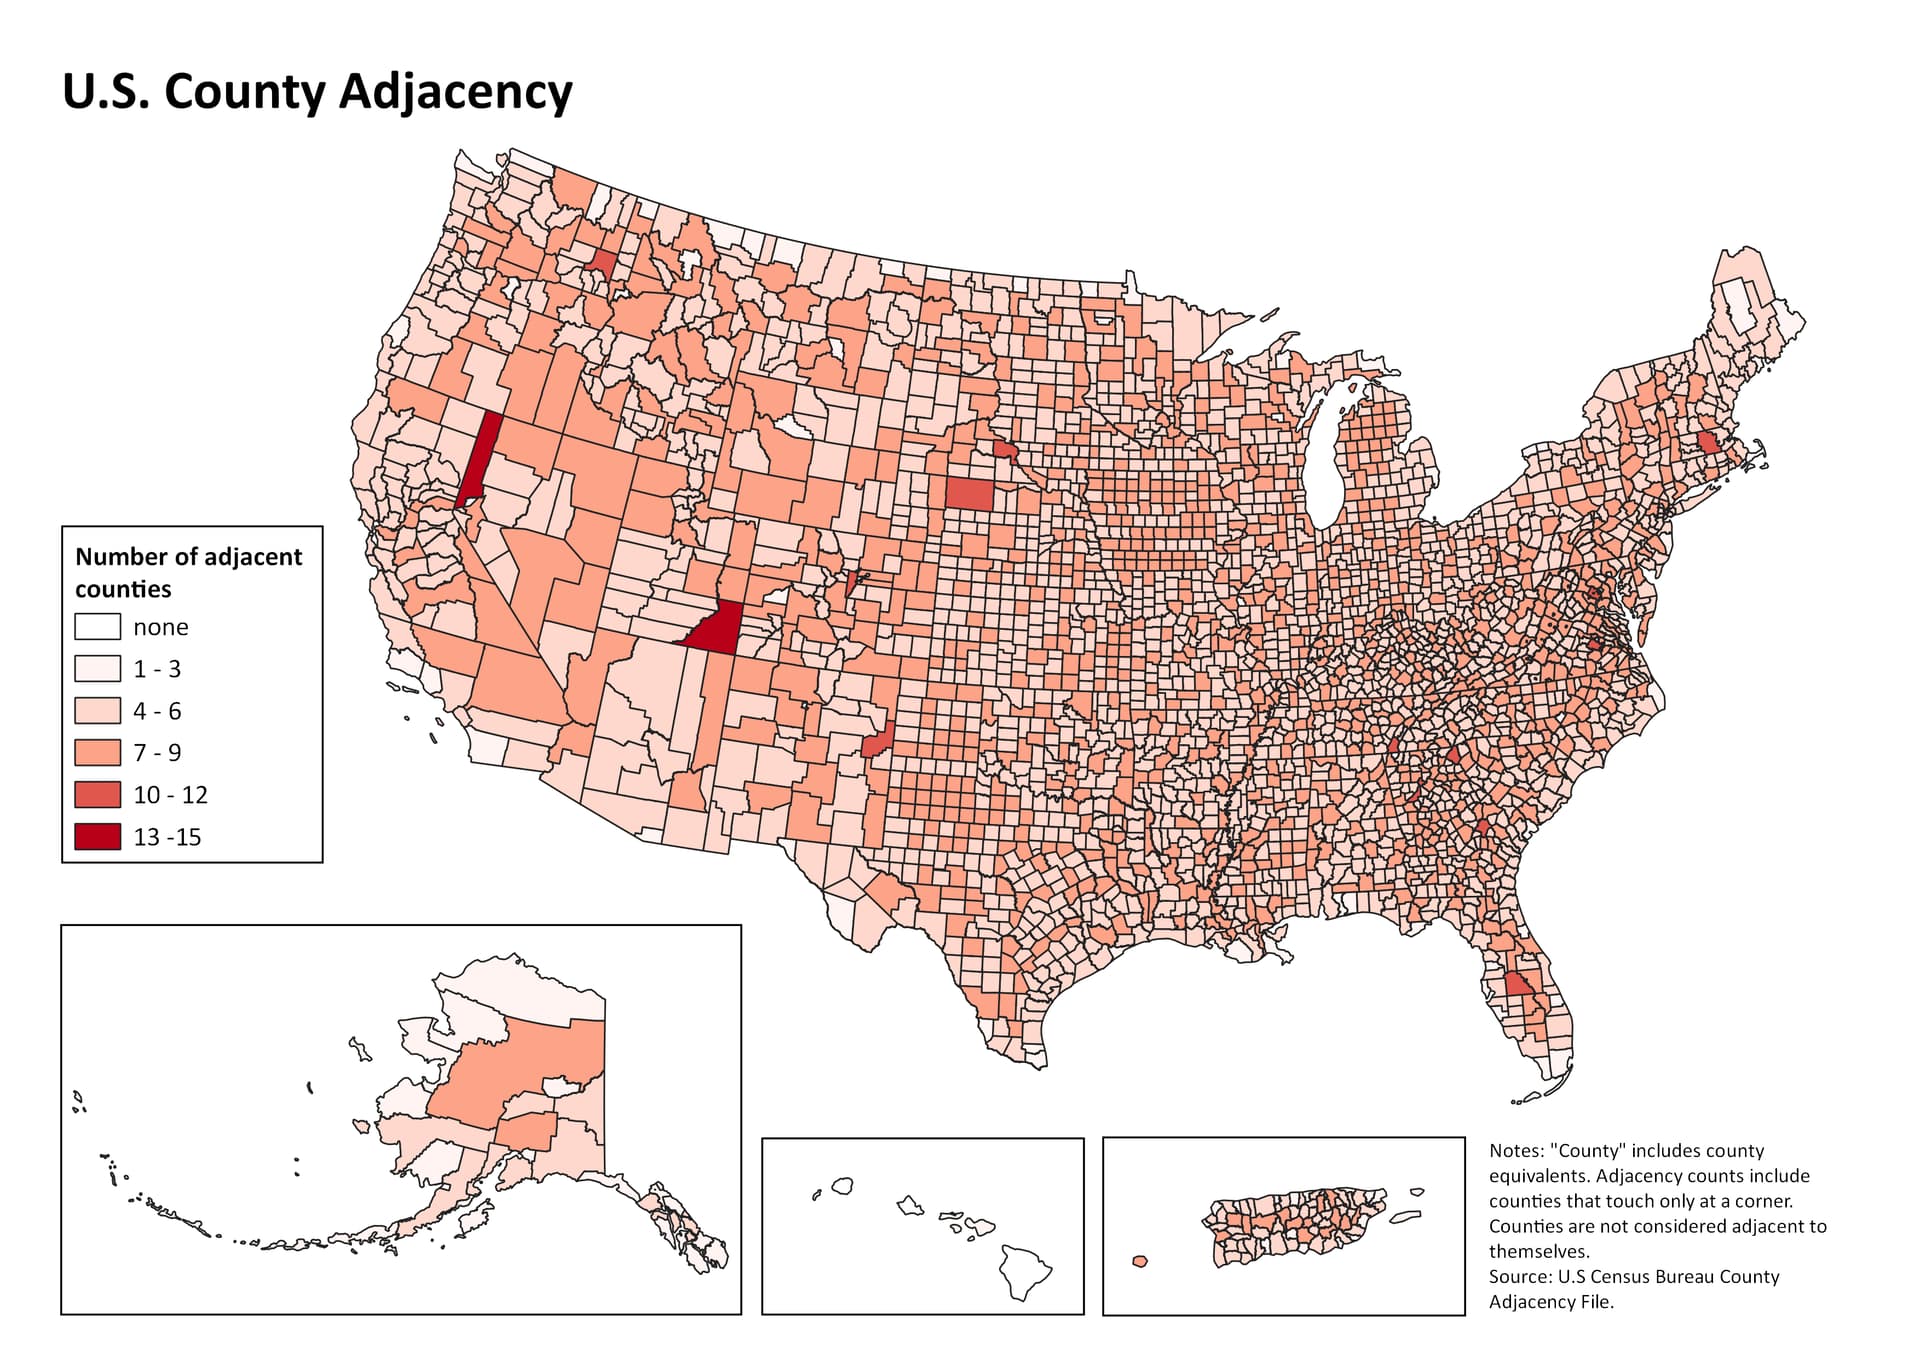
From the Bureau’s notes:
- Counties are considered adjacent if they share an edge or have a point-to-point connection.
- In some instances, the boundary between two counties may fall within a body of water, so it seems as if the two counties do not physically touch. These counties are included on the list as neighbors.
- Every county includes itself as a neighboring county.
Most counties have 5-9 neighbors:
| COUNT_of_NeighborFIPS | COUNT | PERCENT |
|---|---|---|
| 1 | 10 | 0.3092145949 |
| 2 | 26 | 0.8039579468 |
| 3 | 35 | 1.0822510823 |
| 4 | 85 | 2.6283240569 |
| 5 | 274 | 8.4724799011 |
| 6 | 687 | 21.243042672 |
| 7 | 1122 | 34.693877551 |
| 8 | 699 | 21.614100186 |
| 9 | 229 | 7.0810142239 |
| 10 | 52 | 1.6079158936 |
| 11 | 11 | 0.3401360544 |
| 12 | 2 | 0.061842919 |
| 14 | 1 | 0.0309214595 |
| 15 | 1 | 0.0309214595 |
The “winners”:
| County | CountyFIPS | COUNT_of_NeighborFIPS |
|---|---|---|
| San Juan County, UT | 49037 | 15 |
| Washoe County, NV | 32031 | 14 |
| Cherry County, NE | 31031 | 12 |
| Chesterfield County, VA | 51041 | 12 |
| Emanuel County, GA | 13107 | 11 |
| Lyman County, SD | 46085 | 11 |
| Polk County, FL | 12105 | 11 |
| Fairfax County, VA | 51059 | 11 |
| Oconee County, SC | 45073 | 11 |
| Jefferson County, CO | 08059 | 11 |
| Fulton County, GA | 13121 | 11 |
| Worcester County, MA | 25027 | 11 |
| Whitman County, WA | 53075 | 11 |
| Quay County, NM | 35037 | 11 |
| Hamilton County, TN | 47065 | 11 |
11 Likes
17 Likes
Very true in GA… whenever we go walk at our local park, there are tons of those sweetgum burrs on the paths… and I see those cute little green anoles very often!
13 Likes


10 Likes
Lima … I had no idea
8 Likes
This guy curates a list of 5,000+ ArcGIS server addresses at all levels of USA government.
I haven’t dug into it yet, but it looks incredibly useful if you’re into GIS mapping.
7 Likes